Accounting with Excel for Small Business Owners
Excel is the preferred tool of choice for many small business owners. This spreadsheet software can be used for basic bookkeeping tasks as well as complex data management.
A survey report found that about 69 percent of small businesses rely on Excel for accounting purposes. The app can process a large amount of data. It can also present data in a variety of graphs and charts.
This guide offers valuable Excel bookkeeping tips for small business owners. After reading this post, you will learn how to perform basic accounting tasks using spreadsheet software. If you use outsourced bookkeeping services, you will learn how to
Excel Accounting Tips for Beginners
Excel is a robust app available for Windows, Android, macOS, and iOS devices. Microsoft first released this spreadsheet software for Mac in 1985. It was later released for Windows in 1987.
The spreadsheet software consists of rows and columns.
Rows in Excel are numbered while columns are identified by a letter. The intersection of the row and column is called a cell.

There are 1,048,576 rows and 16,384 columns in Excel. This means you can enter 17,179,869,184 data in a single spreadsheet. This is more than adequate for small business owners for bookkeeping purposes.
The app also allows you to create multiple sheets. You can create 255+ worksheets limited by the available system memory. Unless you have a powerful computer, you shouldn’t create more than 20 sheets in a workbook.
Now that you have a general overview of the spreadsheet app, let’s take a close look at the functions and formulas for entering accounting information.
Entering Accounting Data in Excel
A chart of accounts contains a list of every account along with a code and description. Creating a chart of accounts will make it easy for you to monitor several income and expense accounts. Here is a typical list of a chart of accounts in excel.
| Accounts | Code | Description |
| Cash | 1001 | Cash at bank |
| Accounts Receivable | 1002 | The amount receivable from customers |
| Accounts Payable | 1003 | The amount payable to vendors |
| Expenses | 1004 | Expenses incurred during the period |
| Inventory | 1005 | Inventory amount |
| Sales | 1006 | Sales revenue during a period |
| Capital | 1007 | Capital invested in the business |
| Liabilities | 1008 | Liabilities incurred by the business |
The above list is not exhaustive. You can add other accounts based on the requirements of your business.
Once you have added a chart of accounts in an excel sheet, the next step is to add bookkeeping entries in excel.
You must record bookkeeping entries in Excel in chronological order. Each entry should include the date, account title, code, and amount. If you are using an accrual-based accounting method, you should also include debit and credit entries as shown in the image below.
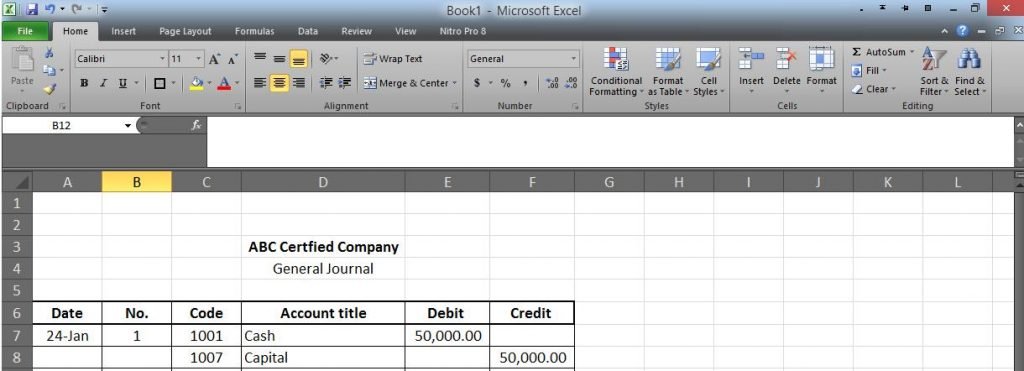
If the journal entry is for a new business, you will make an entry for the capital invested in the business. Suppose that you are the owner of ABC certified company. You have opened a checking account transferring $50,000 from your savings account.
The double entry will result in entry to cash and capital account. All the values should be entered as a positive amount in Excel. Note that the spreadsheet app will enter the values without commas by default.
Adding a comma will make the figures more presentable. You should select cells with values, and click on the comma icon in the menu bar.

After you have made all the entries, you have to transfer the values in the respective account in a separate sheet. Excel creates three sheets titled Sheet 1, Sheet 2, and Sheet 3 by default. You should name Sheet 1 as General Journal, Sheet 2 as Accounts, and Sheet 3 as Financial Statements, as shown in the image below.

Creating and Managing Accounts
You will have to enter amounts from the general ledger to the respective accounts.
Click on the Accounts sheet, and enter the chart of accounts you have created previously. Now, you will have to transfer the amounts from the General Journal sheet.
To transfer the amounts, you should use the Sum function to add the respective values. Let’s suppose you have made the following accounting entries.
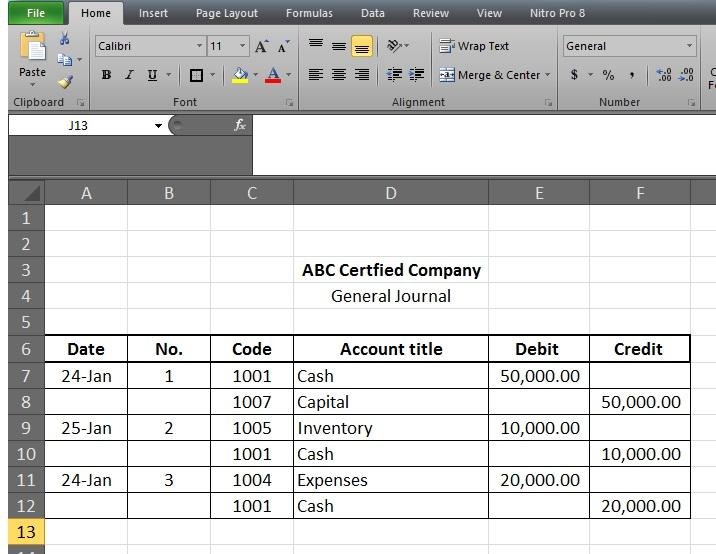
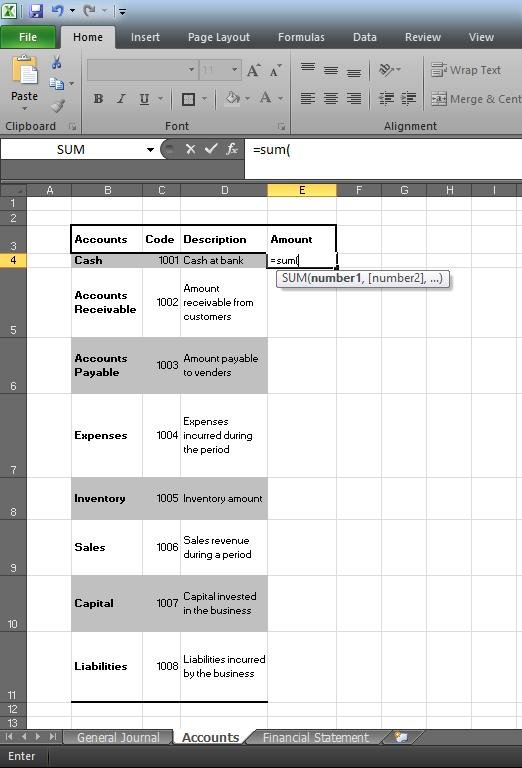
You should click on the Accounts sheet, and then double click on a blank cell next to an account. Next, you must type ‘=Sum(’ as shown in the image below.
You should next click on the General Journal and select a value. Next, type ‘+’ or ‘-’, and select another value. You should type ‘+’ if it’s a debit value and ‘-’ if it’s a negative value.
Keep on pressing ‘+’ or ‘-’ until you have selected all the values of an account, as shown in the image below.
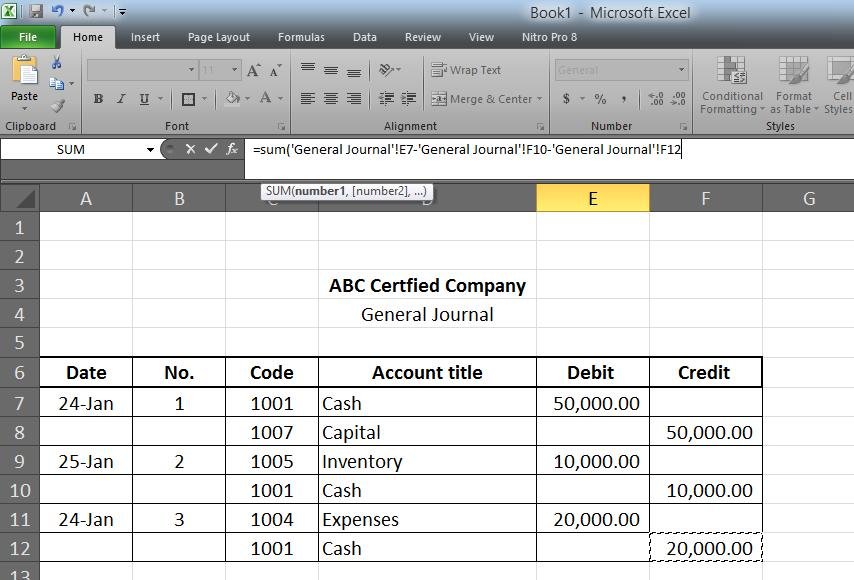
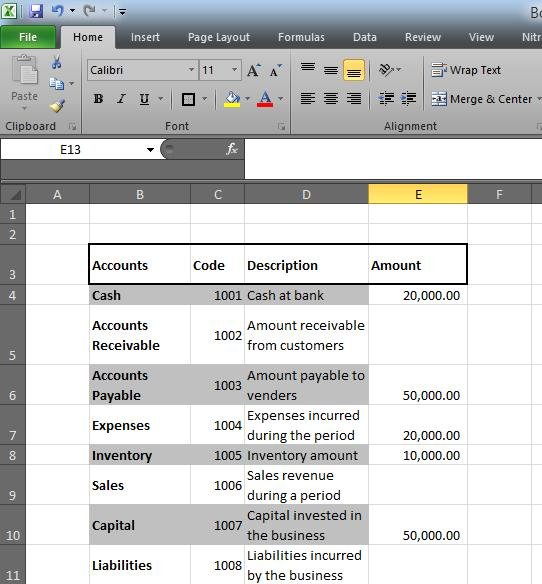
You should press enter and the values will be summed up automatically in the Accounts sheet. Continue with the same steps for all the other accounts. The following image shows the Cash, Capital, Inventory, and Expenses accounts after adding all the values in Excel.
Generating Financial Statements
At the end of the accounting period, you can create financial statements that include an income statement and balance sheet in excel.
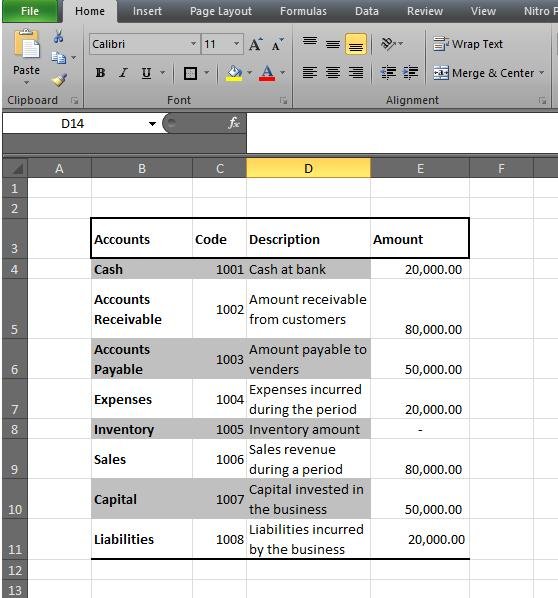
Let’s continue with the example above and suppose that you made sales of $80,000 on credit. Also, assume you purchased the inventory of $20,000 on credit from a vendor and $20,000 was payable to employees at the end of the period.
For the sake of simplicity, let’s assume that you did not incur any other expenses or liabilities during the year. The chart of accounts below reflects the transactions made during the year.
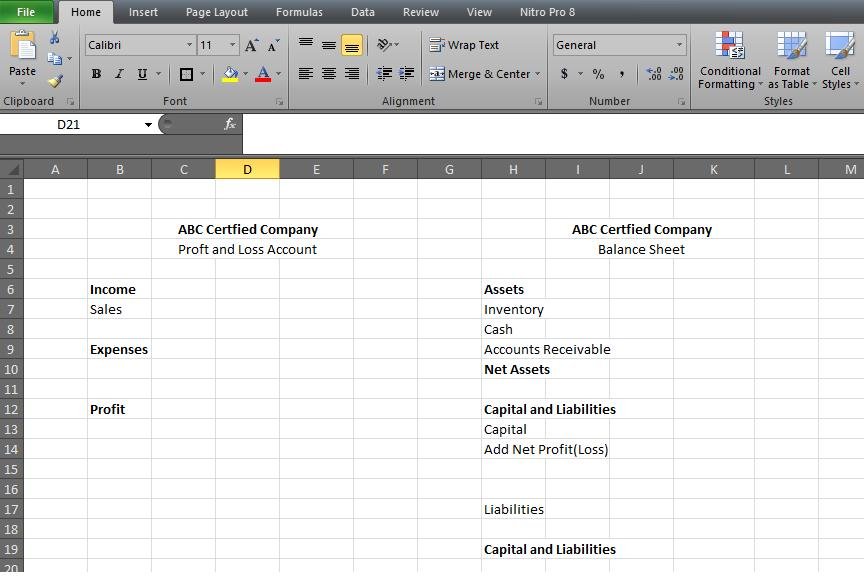
You should next create financial statements in the sheet that we had named Financial Statements. You should add the sections shown in the image below in the profit and loss and balance sheet.
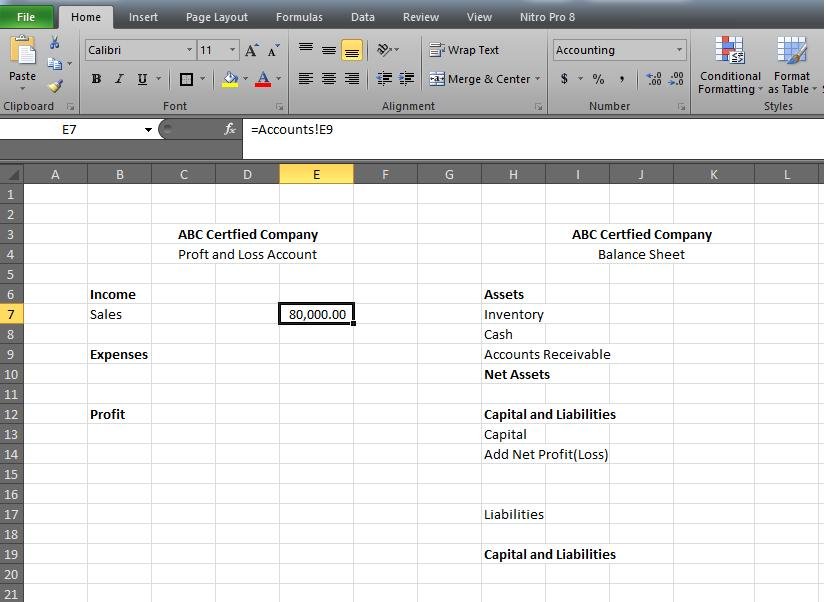
Next, you should enter a blank cell next to Sales, and type =. You should then select the Accounts sheet, click on Sales value, and press enter. Excel will transfer the amount to the selected cell, as shown in the image below.
You should transfer the values of all the accounts by selecting them individually. Once you have transferred the values, you can calculate profit (or loss) in the income statement, and assets, capital, and liabilities in the balance sheet.
To calculate profit, you should select a cell next to Profit, type ‘=’, and then click on the sales amount. You should then type ‘-’ and select the expenses. Press enter and Excel will automatically calculate the profit figure.
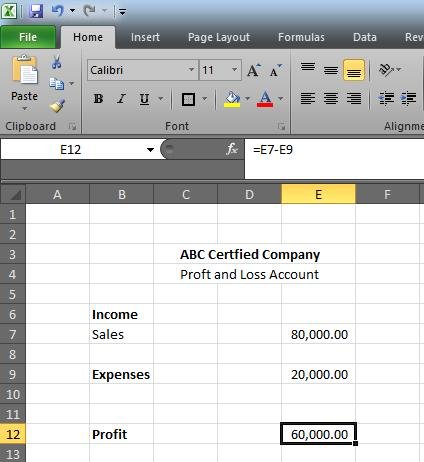
The second step is to prepare the balance sheet. You should first transfer the profit figure to the balance sheet. Click on a blank cell next to ‘Add Net Profit(Loss)’ and select the profit amount.
Next, you should sum up the Capital account using the SUM formula in excel. Type ‘=sum(’ and select the Capital and profit figure in the balance sheet, as shown in the image below.
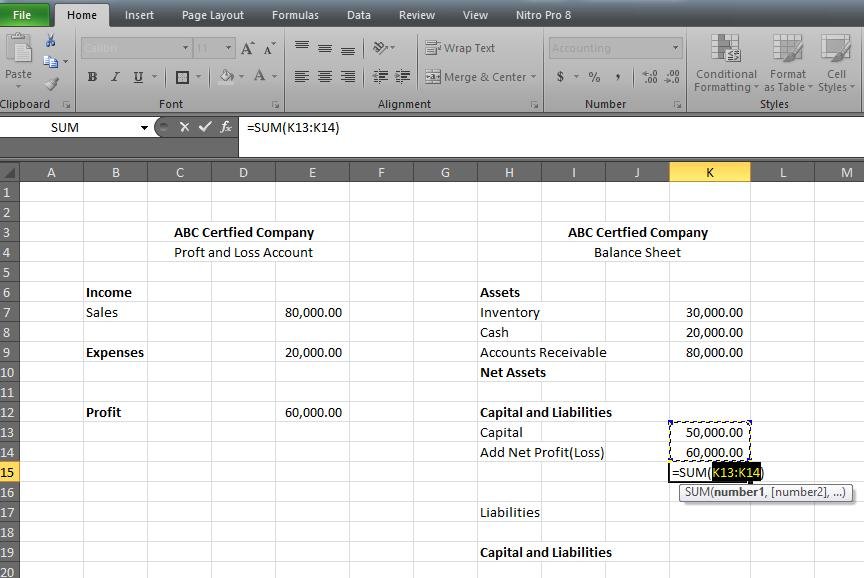
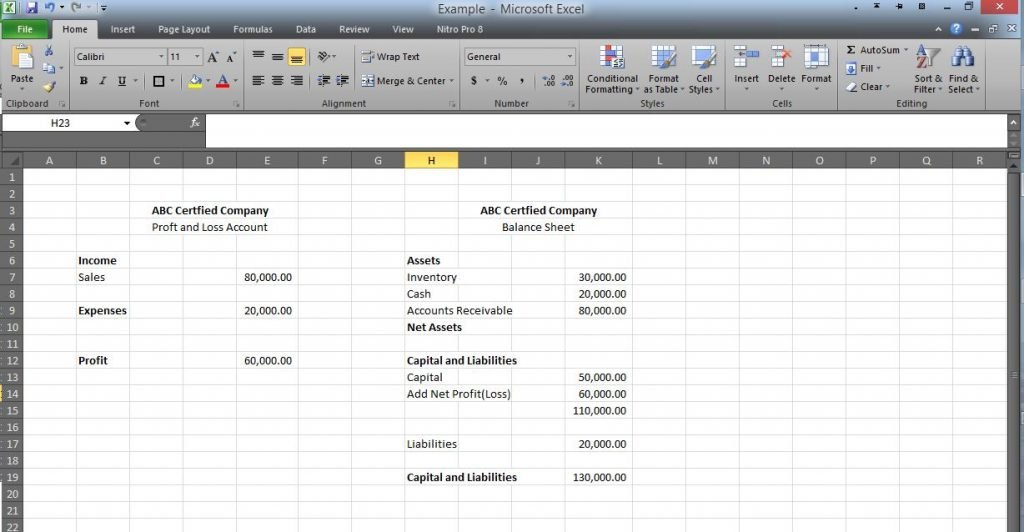
When you press enter, Excel will automatically calculate the increase in the Capital amount. The next step is to sum the Inventory and Cash accounts as well as Capital and Liabilities accounts using the SUM formula.
Note: You can type the formula or use a keyboard shortcut in Excel. Just select a cell, and then press enter ALT+. This shortcut only works when there are amounts above the blank cell.
Creating a Cash Flow Statement
The next important step in accounting with excel is to create a cash flow statement.
Cash flow statements show the inflow and outflow of cash during a period. You should create a separate sheet to create this statement.
To create a new excel sheet, you should press the Shift+F11 button on your keyboard. This will create a new sheet to the left of the currently selected sheet in Excel. You should change the name of the new sheet to ‘Cash Flow Statement’
Note: The alternative to creating a new sheet is to click on the icon next to the last sheet of the workbook, as shown in the image below. This will create a new sheet to the right of the current sheet.

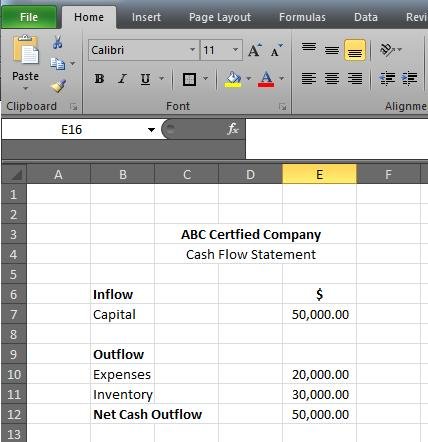
Next, you should type Inflow and Outflow. Enter transfer all accounts and the respective amount that increased cash. In our example, the capital amount of $50,000 increased Cash. Also, the cash amount decreased when you purchased inventory valued at $30,000 and incurred an expense of $20,000. This means that net cash flow was 0 during the period, as shown in the image below.
Congratulations! You have now learned how to create accounting entries and prepare financial statements in Excel. You must save the file on your computer. You should consider hiring professional bookkeeping services to record and maintain accounting information using excel.
Visualizing Accounting Information Using Charts
One of the great features of Excel is that it lets you visualize the accounting information. You can create charts and graphs to get a better understanding of the financial position of your company.
Here is an overview of the different ways you can present the accounting data in Excel using charts.
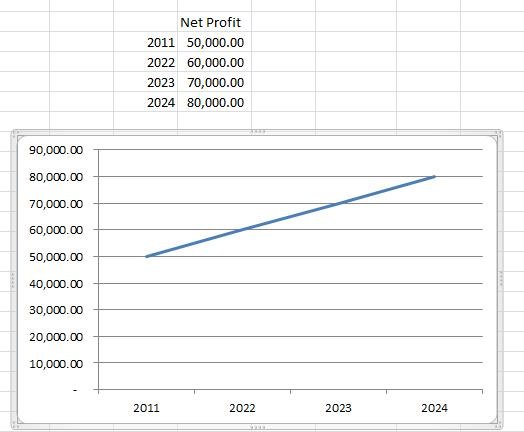
1. Line Chart – This is a great way to show the trend of profit (loss) over a specific period.
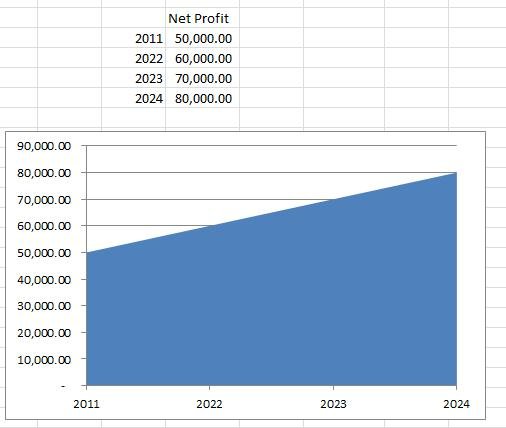
2. Area Chart – The cart is similar to the line chart except for the area below the line is filled.
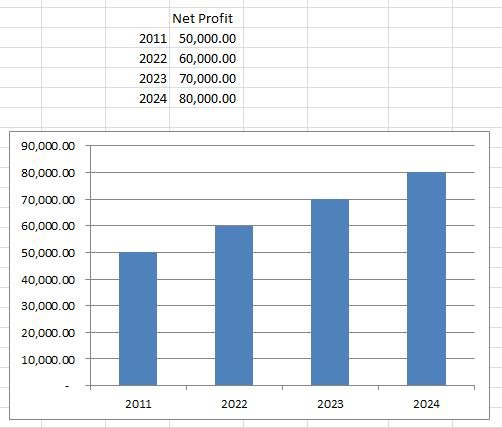
3. Column Chart – This type of chart is appropriate for comparing values during different periods.
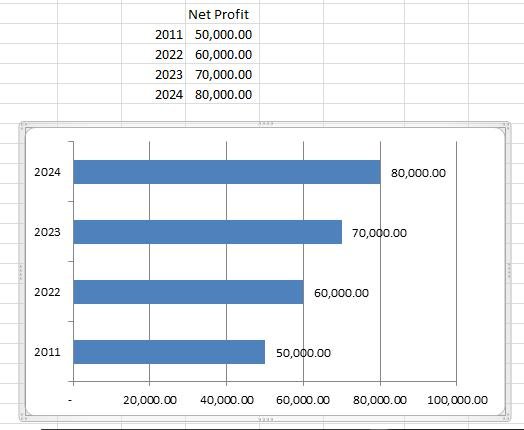
4. Bar Chart – A bar chart is similar to a column chart but the figures are horizontally instead of vertically.
5. Pie Chart – The chart can help determine the share of different values as compared to the whole.
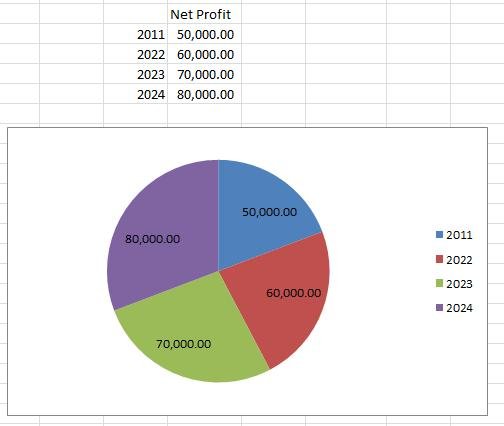
6. Doughnut Chart – The doughnut chart is similar to a pie chart but with a hole at the center.
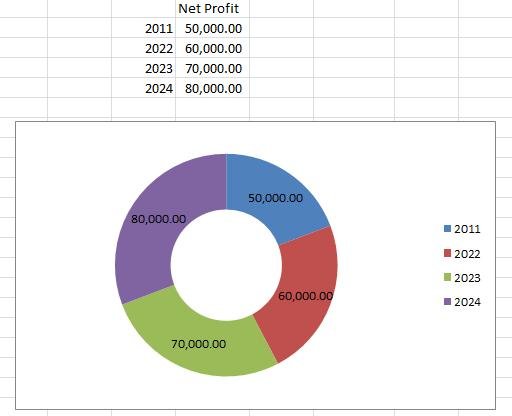
7. Surface Chart – A surface chart can also help compare amounts in different periods. The figures are represented in the form of stars.
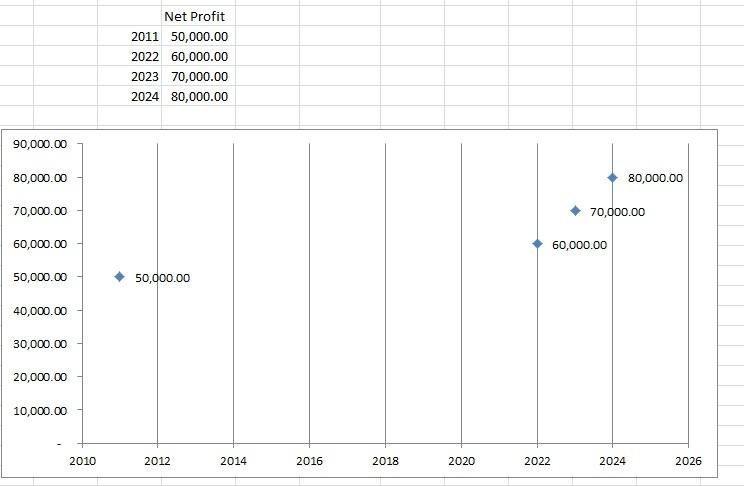
8. Bubble Chart – The chart is an alternative to the bubble chart. Instead of stars, the figures are shown as bubbles in the chart.
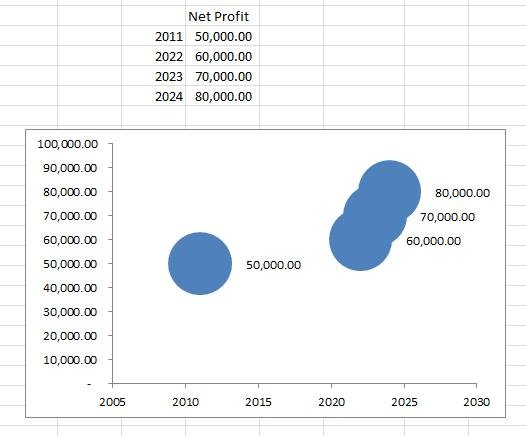
Other types of charts that can be displayed in excel include Radar, Surface, Stock, and X Y Scatter charts. But these carts are suitable for academicians researching trends. These are not appropriate for visualizing accounting information.
How to Create Charts in Excel?
Creating charts and graphs in Excel is not that difficult. The following steps will show you how to create a chart that summarizes accounting data.
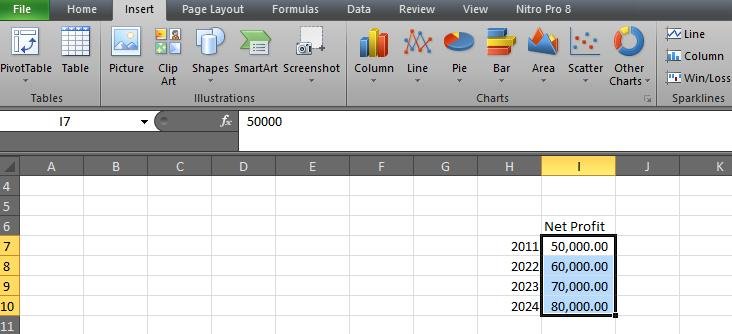
Let’s create a chart for the net profit figures for four years – 2021 to 2024. Assume that the profit amounts are as follows.
| Year | $ |
| 2011 | 50,000.00 |
| 2022 | 60,000.00 |
| 2023 | 70,000.00 |
| 2024 | 80,000.00 |
To create a chart, you should first select the amounts using the mouse and then click Insert. Next, you should select the desired chart.
The next step is to enter the years in the chart. You should right-click the chart and click on Select Data as shown in the image below.
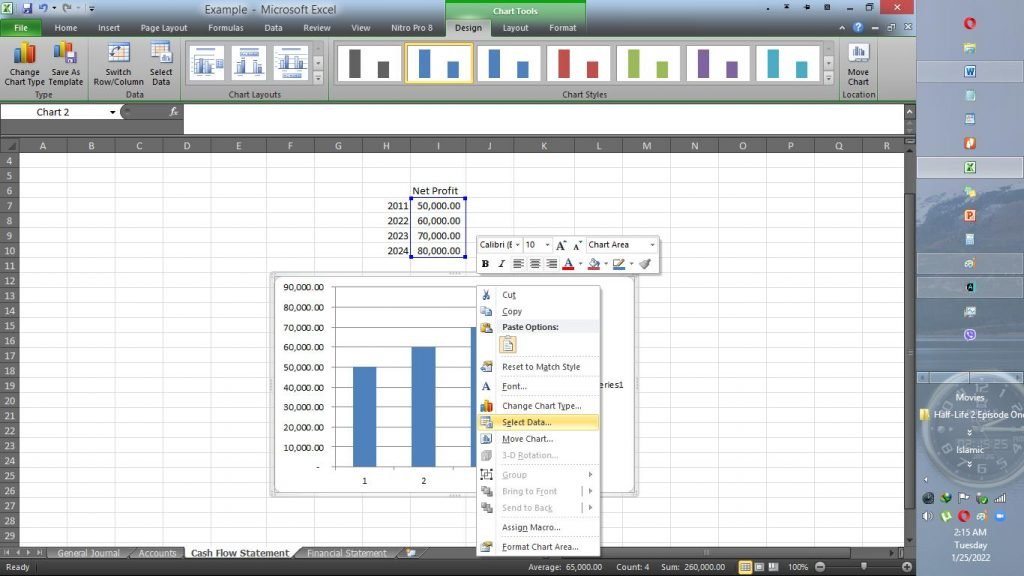
You should then click on Edit, and select the Years. Excel will update the chart when you click on the OK button.
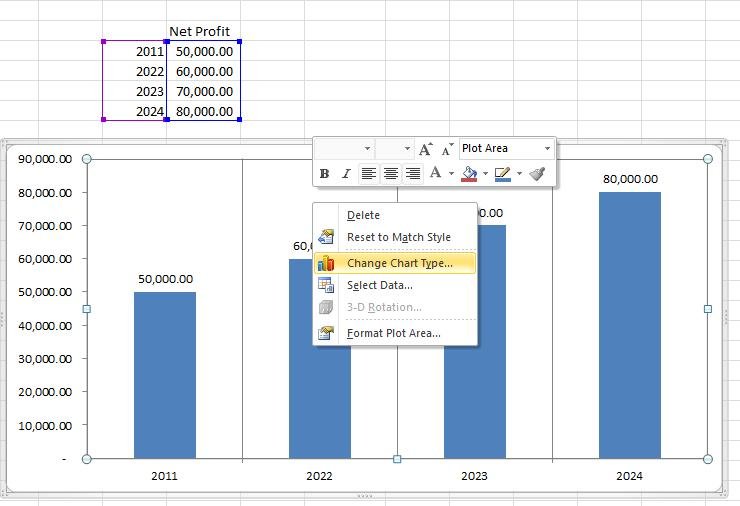
Excel also allows you to change the chart type at any time. Just right-click on the chart, and select Change Chart Type. You can then select the desired chart in the next window.
Understanding Basic Function in Excel
You must have an understanding of the basic functions that are used in excel. Here we will briefly discuss some of the important functions in Excel that can be valuable when using the app for recording financial information.
1. SUM Function
We have mentioned the SUM function above. The formula consists of the following parts.
=Sum(range)
‘=’ tells Excel that you are about to type a formula. The SUM is a function that you want to use to add values. It is one of the hundreds of functions available in the Formulas tab.
Lastly, the () tells excel the start and end of the range. The range consists of two values divided by a colon ‘:’. The first value tells the cell address of the starting value of the range, while the second value tells the address of the last value in the range.
For instance, the range D2:D4 tells excel that the first value is in the D2 cell, and the last value is in the D4 cell. Excel will select all the values in the range.
2. CountIF Function
Another common Excel function is CountIF. This function allows you to set conditions for counting values in a range of cells. For instance, you can set conditions to count values in a column A1 to A15 that are greater than 5,000. You should type the following formula.
=CountIF(A1:A15,“>=5000”)
In the above formula, = tells Excel that you are going to type a function. You must type CountIF and then specify the cell range and condition within the brackets. In the above example, you are specifying that you want Excel to count values in the cell range A1 to A15. The values between inverted commas tell Excel that it must count values only if the values are greater than 5,000. Excel will display the results based on your specified condition. Here are the formulas for specifying other common conditions using the function.
- Count if less than a value = CountIF(A1:A15,“<=5000”)
- Count if equal to a value = CountIF(A1:A15,“=5000”)
3. INDEX and MATCH Function
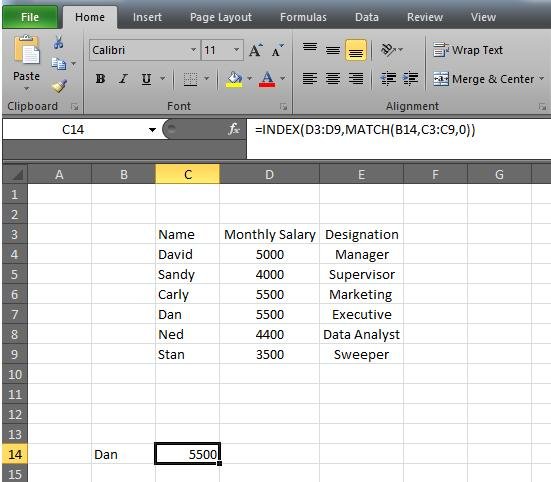
The combination of INDEX and MATCH functions is useful when preparing a report. You can use the function to find corresponding values from a table. Let’s suppose you have prepared a table containing the name, salary, and designation of employees. Now suppose that you want to prepare a report showing the salary of one employee in a report. You can use the following formula for this purpose.
=INDEX(D3:D9,MATCH(B14,C3:C9,0))
In the above formula, the first range D3 to D9 denotes that you want to look at the salary column. The second range C3 to C9 shows that you want to match the name with the salary. Lastly, cell addresses B14 specify the name of the employee you want to search. Here is a screenshot of the results that will be displayed when you enter the formula.
Keyboard Shortcuts to Save Time
You can use keyboard shortcuts in excel to save time when making bookkeeping entries. Let’s look at some of the common shortcuts in macOS and Windows.
1. Select Entire Row/Column
One of the most common tasks when using Excel for accounting is selecting rows and columns. A time-saving shortcut for this task is to press the following keys on macOS and Windows.
- SHIFT+SPACEBAR = Select entire row
- CTRL (CONTROL)+SPACEBAR = Select entire column
- SHIFT+CTRL (CONTROL)+SPACEBAR = Select entire worksheet
2. Edit a Cell
Another common task in accounting with excel is to left-click to edit a cell. You can use the following keyboard shortcuts to quickly edit a cell in Windows and macOS. Using the shortcut will save time in editing accounting entries.
- Windows = F2
- macOS = CONTROL+U
3. Switch Sheets
You will have to work on multiple sheets when working on Excel for accounting. Here are the keyboard shortcuts for switching between the sheets. You can use these shortcuts to cycle through multiple sheets in Excel in Windows and macOS.
- Next Sheet = CTRL (CONTROL) + PgDn
- Previous Sheet = CTRL (CONTROL) + PgUp
4. Copy and Paste Values
A lot of time is spent copying and pasting values in Excel. Instead of using a mouse to copy and paste accounting values, you can use the following keyboard shortcuts.
- Copy Values = CTRL (CONTROL) + C
- Paste Values = CTRL (CONTROL) + V
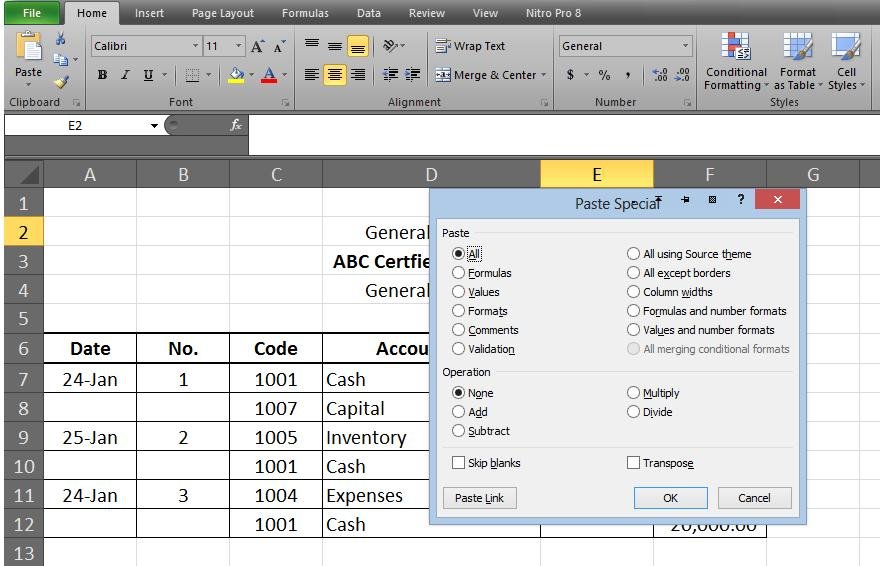
Sometimes you want to paste formulas, values, formats, or comments in a cell. A quick way to paste special values is to use the following keyboard shortcut.
- Windows = CTRL (CONTROL) + ALT + V
- macOS = CONTROL + OPTION + V
5. Underline Values
Underlining values is a common formatting style when working with Excel for accounting. You want to underline values to separate different accounts in Financial Statements. Here is a quick way to underline values using your keyboard.
- Underline values = CTRL (CONTROL) + 4
6. Apply Currency Formatting
Applying currency formatting involves a lot of time in Excel. A shortcut to quickly apply currency formatting to values is to press the following buttons.
- Apply currency formatting = Shift + CTRL (CONTROL) + 4
7. Line Break Within a Cell
Data presentation is important for clear understanding. Sometimes you would want to add a list of items in a single cell. A shortcut to making the text value more presentable is to use the following keyboard shortcut for a line break in Windows and macOS.
- Line Break in a cell = Alt (OPTION) + Enter
7. AutoSum Rows or Column
You can save a lot of time when accounting with excel using the following keyboard shortcut for adding values in rows or columns.
- Windows = Alt + =
- macOS = Command + Shift + T
8. SAVE File
You should save your Excel file regularly. This is important to ensure that the work time is not lost if the computer freezes or restarts unexpectedly. One method is to click on the small floppy disk button above the file menu in excel. Another quick way to save files is to use the following keyboard shortcut to save files.
- Windows = CTRL + S
- macOS = COMMAND + S
9. Toggle Values and Formulas
You may want to look at formulas used in cells when looking for errors. Here is a handy shortcut that will toggle between values and formulas in Excel. You should press the following key combination once to display formulas used in cells. Press the keys again to display values.
- Toggle values and formulas = CTRL (CONTROL) + ~
Final Remarks
Excel is simple spreadsheet software that can be used for bookkeeping purposes. You can use the spreadsheet app for recording and monitoring income and expenses. The app allows you to visualize the data to better understand the financial position of your company.
Microsoft has made available dozens of free templates on its website. You can download an accounting template if you don’t want to manually create a general journal and financial statements in Excel. The templates are pre-filled with formulas that automatically calculate the required values when you enter financial information.
A con with using Excel for accounting is that it takes a lot of time in creating and managing bookkeeping entries. You will have to manually enter information from journal entries to create an income statement and balance sheet. It also increases the chances of errors that will result in imprecise reflection of your company’s financial position.
Join 1000s of Small Businesses and CPAs who outsourced their Bookkeeping to Maxim Liberty!
Try our award winning services with little to no risk. We have an unconditional money back guarantee on your 1st payment. Just 5 minutes of your time over the phone, can get you the best Bookkeeping rates in USA while saving you hundreds of dollars.
